

Detection engineering is the systematic discipline of designing, building, testing, deploying, and maintaining the detection logic that converts raw telemetry into high-fidelity, actionable alerts — and it is the operational foundation that separates reactive SOCs from measurable security programs. As Splunk's complete guide to detection engineering explains, the discipline maps attacker behaviors directly to detection logic, creating a traceable chain from threat intelligence to production rules. Your most productive first step is to select a high-risk MITRE ATT&CK technique relevant to your environment, inventory the telemetry it requires, and author a Detection-as-Code (DaC) rule with positive and negative test fixtures before you write another one.
Pro Tip: Prioritize detections that close the largest coverage gaps against your organization's top three business-impact threats, not the techniques that appear most frequently in threat reports. Frequency and organizational relevance are rarely the same list.
Key Takeaways
Detection engineering is the discipline that converts telemetry into measurable, auditable detection coverage — and the programs that succeed treat rules as production software with owners, tests, and retirement criteria.
| Point | Details |
|---|---|
| Start with telemetry, not rules | Run a gap analysis before authoring detections; a rule without a confirmed data source is a silent failure. |
| Detection-as-Code is the operational standard | Version-controlled rules with CI/CD, unit tests, and canary deployment separate measurable programs from rule backlogs. |
| Continuous validation is required | Monthly BAS runs and quarterly purple-team exercises confirm rules still fire as environments change. |
| AI adds capability and risk | Use AI for anomaly scoring and alert prioritization, but require human review for production changes and log all model decisions. |
| Heightscg delivers structured engagements | Assessment, pilot DaC implementation, and managed program scopes give security leaders a clear path from gap analysis to operational coverage. |
Table of Contents
- Why detection engineering matters for your SOC and your business
- The detection engineering lifecycle: from business drivers to retired rules
- Core technical components: telemetry, instrumentation, and detection patterns
- How Detection-as-Code works in a production pipeline
- Testing and validating detections before they reach production
- Organizational design: who owns detection engineering and how governance works
- How to measure detection program success with the right KPIs
- AI and ML in detection engineering: where they help and where they create risk
- Common obstacles in detection engineering and how to address them
- A 30/90/180-day roadmap to build or mature your detection program
- What actually matters when you implement detection engineering
- How Heightscg supports detection engineering programs
- Primary sources and further reading
- Sources
Why detection engineering matters for your SOC and your business
Most security programs generate alerts. Fewer generate evidence. Detection engineering closes that gap by treating detection logic as a managed, measurable asset rather than a collection of vendor-default rules that no one has reviewed in two years.
The business case is concrete:
- Reduced dwell time. Faster, higher-fidelity detections shorten the window between attacker entry and analyst response, directly limiting breach scope and recovery cost.
- Fewer false positives. Tuned, tested rules reduce alert volume, which means analysts spend time on real threats rather than chasing noise.
- Measurable coverage. A mature detection program maps every rule to an ATT&CK technique, giving leadership a defensible answer to "what can we detect?" rather than a vendor marketing claim.
- Compliance auditability. Versioned, documented detection rules provide the audit trail that HIPAA, PCI-DSS, and CMMC assessors expect. When a rule exists because a control requires it, that traceability is evidence.
- SOC productivity. When analysts trust their alerts, they investigate faster and escalate with confidence. Alert fatigue is a workforce retention problem as much as a security one.
The scale of the alert-noise problem across the industry is significant. Detection engineering addresses that directly by replacing volume with precision. Better detection also reduces incident cost: a breach caught in hours costs materially less to contain than one discovered weeks later, and the difference in regulatory exposure between those two outcomes can be decisive for organizations operating under HIPAA or PCI-DSS.
The detection engineering lifecycle: from business drivers to retired rules
A detection program without a lifecycle is just a rule backlog. The lifecycle below gives each phase a clear input, output, and exit criterion, and it enforces two-way traceability: every rule traces up to a business driver (risk register item, compliance control, or threat intelligence finding), and every business driver traces down to one or more rule IDs.
- Requirements and use-case identification. Input: risk register, threat intelligence, compliance controls. Output: prioritized list of detection use cases. Exit: stakeholder sign-off on top 10 use cases.
- Prioritization. Score use cases by threat likelihood, business impact, and telemetry availability. Exit: ranked backlog with assigned owners.
- Investigation and threat modeling. Map each use case to ATT&CK techniques, identify attacker behaviors, and define what "good" telemetry looks like. Exit: documented threat model per use case.
- Design. Define detection logic pattern (single-event, aggregation, entity-baselining), required data sources, and expected alert fields. Exit: design document reviewed by a senior engineer.
- Develop (DaC). Author the rule in a portable format (Sigma, YARA, or platform-native), add metadata (ATT&CK IDs, owner, severity, data sources), and commit to version control. Exit: rule passes lint and schema validation.
- Test and backtest. Run positive and negative test fixtures against synthetic and historical log data. Exit: both fixture types pass; false-positive rate on historical data is within tolerance.
- Validation and attack simulation. Execute the mapped ATT&CK technique in a lab or via a Breach-and-Attack Simulation (BAS) tool such as Atomic Red Team or Stratus Red Team. Exit: rule fires on simulated attack; no fires on clean baseline traffic.
- Canary deployment. Deploy to a subset of production with alert-only, no-ticket mode. Monitor for 5–10 business days. Exit: false-positive rate confirmed within SLA; analyst tolerance confirmed.
- Operate and tune. Promote to full alerting. Track true-positive rate, false-positive rate, and analyst feedback weekly. Exit: rule meets KPI thresholds for 30 consecutive days.
- Retire. Deprecate rules that no longer map to active threats, have no telemetry, or have been superseded. Exit: retirement decision logged with rationale and approved by the detection lead.
Two-way traceability is the governance mechanism that keeps a detection program honest. When an auditor asks why a rule exists, the answer should be a specific risk register item or compliance control — not "the vendor recommended it." When a CISO asks what the program covers, the answer should be a coverage map, not a rule count.
The CiscoCXSecurity Detection Engineering Framework describes a comparable structured methodology with explicit emphasis on traceability and retirement discipline.
Pro Tip: Gate production promotion on two independent criteria: the rule must pass all technical tests AND at least one SOC analyst must confirm the alert narrative is clear enough to act on without additional context. A technically correct rule that confuses analysts generates tickets, not responses.
Core technical components: telemetry, instrumentation, and detection patterns
You cannot detect what you do not collect. Before writing a single rule, a team must audit its telemetry coverage against the techniques it intends to detect. The CSOH cloud logging guide makes this concrete for cloud environments: AWS CloudTrail, Azure Activity Log, and GCP Cloud Audit Logs each emit different event structures, and a Sigma rule written for one will not port cleanly to another without field mapping.
Minimum fields for reliable detection (log quality baseline):
- Timestamp (UTC, millisecond precision)
- Actor identity (user, service account, or machine identity)
- Source and destination (IP, hostname, or cloud resource ARN)
- Command line or URL (full string, not truncated)
- User-agent or client identifier
- Request payload hash (for file or API operations)
For endpoint telemetry strategy, the data-source matrix below maps common ATT&CK tactic categories to the telemetry types that support detection:
| ATT&CK Tactic | Primary Telemetry | Secondary Telemetry |
|---|---|---|
| Initial Access | Network/proxy logs, email gateway | DNS logs, cloud access logs |
| Execution | Process creation (Sysmon/EDR) | Script engine logs, WMI logs |
| Persistence | Registry, scheduled tasks, service creation | File integrity monitoring |
| Credential Access | Authentication logs (AD, Okta) | LSASS access events, SAM queries |
| Lateral Movement | Network flow, SMB/RPC logs | Authentication logs, EDR telemetry |
| Exfiltration | DLP, proxy/firewall egress | Cloud storage audit logs |
| Command and Control | DNS, proxy, TLS certificate logs | NetFlow, EDR network events |
Detection logic patterns fall into four categories, each suited to different attacker behaviors:
- Single-event: One log entry matches a condition (e.g., a process spawning cmd.exe from a browser). Fast, low-latency, but easily evaded by splitting behavior across events.
- Aggregation and correlation: Multiple events within a time window (e.g., five failed logins followed by a success within 60 seconds). Catches distributed or slow-burn techniques.
- Entity baselining: Deviation from a user's or host's historical norm (e.g., a service account authenticating at 2 AM for the first time). Requires a learning period but catches novel behavior.
- Canary tokens and honeypots: Synthetic assets that should never be accessed legitimately. Any access is a high-confidence signal.
Pro Tip: Collect process creation logs with full command-line arguments from day one. More detection use cases depend on that single field than any other endpoint data source, and retrofitting it after rules are written is expensive.
How Detection-as-Code works in a production pipeline
Detection-as-Code treats every detection rule as production software: it lives in a Git repository, has tests, goes through code review, and deploys through a CI/CD pipeline. That discipline gives teams rollback capability, audit history, and the ability to measure rule quality over time.
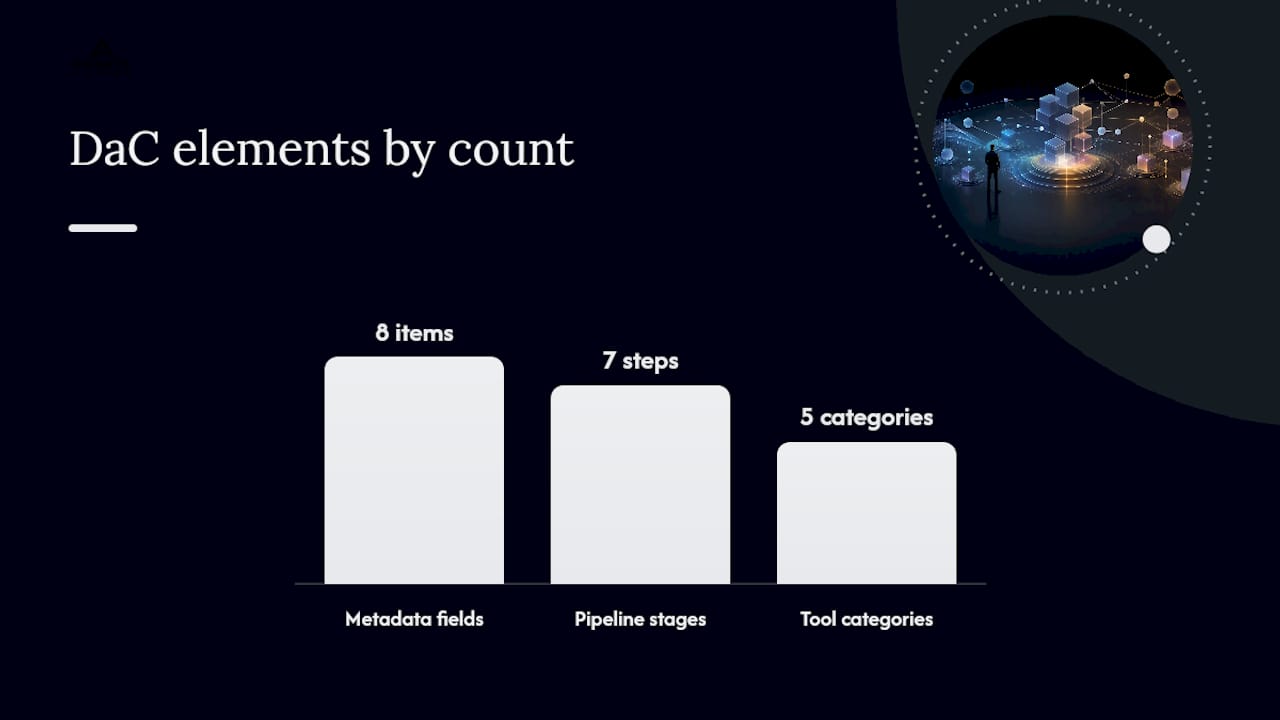
DaC rule anatomy (minimum viable metadata):
- Rule ID and canonical name
- ATT&CK technique IDs (tactic and technique)
- Owner (team or individual)
- Severity and confidence rating
- Required data sources
- Positive test fixture (log sample that should trigger)
- Negative test fixture (log sample that should not trigger)
- Last validated date and validation method
A sample CI/CD pipeline for detection rules:
- Engineer authors rule in Sigma or platform-native format and opens a pull request.
- CI pipeline runs lint (schema validation, required metadata check) and executes unit tests against fixture logs.
- Peer review by a second detection engineer; threat researcher reviews ATT&CK mapping.
- Compile step translates Sigma to target backend (Splunk SPL, Microsoft KQL, Elastic EQL).
- Canary deploy to a subset of production endpoints or log sources.
- Automated monitoring checks alert volume and false-positive rate for 5–10 days.
- Promote to full production or roll back based on canary metrics.
Tool categories and their pipeline roles:
- SIEM (Splunk, Microsoft Sentinel, Elastic Security): Rule execution and alert management.
- EDR/XDR (CrowdStrike Falcon, Microsoft Defender for Endpoint, SentinelOne): Endpoint telemetry and native detection execution.
- Log pipeline (Cribl, Fluentd, Vector): Normalization, enrichment, and routing before rules run.
- BAS and red-team tools (Atomic Red Team, Stratus Red Team, Caldera): Validation and continuous testing.
- CI/CD (GitHub Actions, GitLab CI, Jenkins): Automated lint, test, compile, and deploy.
Canonical repo folder structure:
detections/
  initial-access/
  execution/
  persistence/
  lateral-movement/
tests/
  fixtures/
    positive/
    negative/
docs/
  use-cases/
  threat-models/
Pro Tip: Use Sigma as the authoring format even if your primary SIEM is Splunk or Sentinel. Sigma's portability means a rule written today survives a platform migration, and the community rule library gives you a tested starting point for common techniques.
Testing and validating detections before they reach production
A rule that has never been tested against a real attack is a hypothesis, not a detection. The SANS purple-teaming guide frames this clearly: continuous collaboration between red and blue teams is what separates validated detection coverage from assumed coverage.
Testing tiers, in order of execution:
- Unit tests. Run positive and negative fixture logs through the rule logic before any deployment. This catches syntax errors and logic inversions in minutes.
- Backtesting. Replay 30–90 days of historical production logs through the new rule. Identifies chronic false-positive sources before the rule goes live.
- Scheduled BAS. Run Atomic Red Team or Stratus Red Team on a monthly cadence against the techniques each rule covers. Confirms the rule still fires as the environment changes.
- Purple-team validation. Quarterly structured exercise where red team executes a scenario and blue team confirms detection, triage, and escalation all function end-to-end.
- Continuous replay. Automated scheduled replay of known-good attack simulations against production rules, with alerting when a previously passing rule stops firing.
Deployment checklist for promoting a rule from canary to production:
- Unit tests pass (positive and negative fixtures)
- Backtesting false-positive rate within SLA (typically below 5% of alerts)
- BAS validation confirms rule fires on simulated technique
- Canary monitoring period complete (minimum 5 business days)
- SOC analyst has reviewed alert narrative and confirmed it is actionable
- Rule metadata complete (owner, ATT&CK IDs, severity, data sources)
- Decision logged in the detection registry
Continuous validation matters because environments change. A rule that fired reliably six months ago may silently stop firing when a log source changes format, an agent is updated, or a data pipeline is reconfigured. Automated replay schedules catch that regression before an attacker does.
Organizational design: who owns detection engineering and how governance works
Detection engineering and SOC analysis are distinct functions that require different skills and different KPIs. Conflating them is one of the most common maturity gaps Heightscg observes in client programs.

| Role | Primary Responsibility | Key KPI | SLA Expectation |
|---|---|---|---|
| Detection Engineer | Author, test, and maintain detection rules | Rule coverage by ATT&CK tactic; false-positive rate | New rule from use case to canary in 10 business days |
| Threat Researcher | Threat intelligence, ATT&CK mapping, use-case identification | Use cases identified per quarter | Monthly threat intel digest |
| SOC Analyst | Alert triage, investigation, escalation | Mean time to disposition (MTTDISPO) | Tier-1 triage within minutes of alert |
| Incident Responder | Containment, eradication, recovery | Mean time to contain (MTTC) | Engagement within 30 minutes of escalation |
| Product/Asset Owner | Telemetry requirements, tuning feedback | Telemetry coverage for owned systems | Respond to tuning requests within 5 business days |
| CISO | Program governance, risk acceptance, budget | Coverage vs. risk register; program maturity score | Quarterly program review |
Governance patterns that prevent rule decay:
- PR review policy: No rule reaches canary without a second engineer's approval and a threat researcher's ATT&CK mapping confirmation.
- Maintenance SLA: Every rule owner reviews their rules quarterly. Rules with no owner are flagged for reassignment or retirement within 30 days.
- Decision log: Every retirement, exception, or tuning decision is documented with rationale and approver.
- Retirement criteria: A rule is a retirement candidate if it has not fired in 180 days, its data source is no longer available, or it has been superseded by a higher-fidelity rule.
Pro Tip: Bring product and asset owners into detection acceptance reviews. They know when a process or service behaves in ways that look suspicious but are legitimate, and their input during canary review prevents the false-positive cycles that erode analyst trust.
How to measure detection program success with the right KPIs
Metrics give leadership a factual basis for investment decisions and give detection engineers a feedback loop for improving rule quality. The Splunk detection engineering guide notes that detection engineering requires distinct KPIs from SOC analysis, specifically rule coverage, mean time from finding to detection, and maintenance cost per rule.
| KPI | Definition | Target |
|---|---|---|
| ATT&CK tactic coverage | Percentage of ATT&CK tactics with at least one validated rule | the majority of prioritized tactics |
| True-positive rate | Alerts confirmed as real threats / total alerts | Above 60% per rule |
| False-positive rate | Alerts confirmed as benign / total alerts | Below 10% per rule |
| Mean time from finding to detection (MTTFD) | Days from threat intel finding to validated rule in production | Under 15 business days |
| Mean time to disposition (MTTDISPO) | Minutes from alert creation to analyst close or escalation | Under 30 minutes for Tier-1 |
| Rule maintenance cost | Engineering hours per rule per quarter | Tracked; used for retirement decisions |
Dashboard surfaces by audience:
- Executive/CISO view: ATT&CK coverage heatmap, trend in true-positive rate, open use cases vs. backlog, and program maturity score against a framework like NIST CSF.
- Detection engineer view: Per-rule false-positive rate, rules pending review, canary alert volume, and BAS pass/fail rate by technique.
- SOC analyst view: Alert volume by rule, MTTDISPO by rule, and rules with the highest false-positive rates (candidates for tuning).
Translating detection metrics into business risk terms requires one additional step: map each covered ATT&CK technique to the business processes it protects and estimate the expected loss reduction from earlier detection. A rule that catches credential theft in 20 minutes instead of 20 days has a calculable impact on breach scope, regulatory exposure, and recovery cost. That translation is what turns a coverage percentage into a budget conversation.
AI and ML in detection engineering: where they help and where they create risk
AI and machine learning offer genuine capability improvements for detection programs, and they also introduce new risks that teams must govern explicitly. The NIST AI Risk Management Framework provides the governance structure detection teams should align to when deploying AI for detection or when AI systems become part of the detection surface itself.
Where AI/ML adds value:
- Anomaly scoring: ML models establish behavioral baselines per entity (user, host, service account) and score deviations, catching novel techniques that signature rules miss.
- Alert prioritization: Classifiers rank alerts by predicted true-positive likelihood, helping analysts focus on the highest-confidence signals first.
- Rule draft generation: LLMs can generate Sigma rule drafts from threat intelligence reports, accelerating the authoring step. The output requires human review before any testing.
- Cross-source correlation: ML models identify relationships across disparate log sources that rule-based correlation would miss due to time-window or field-matching constraints.
- Signal enrichment: Automated enrichment (threat intel lookups, asset context, user risk scores) reduces analyst research time per alert.
Risks AI introduces to detection programs:
- LLM-noise: Attackers using LLMs produce higher volumes of plausible-looking traffic that degrades signature-based detection. As research on LLM-noise in the detection context explains, this shifts the advantage toward behavioral, correlation, and per-entity baselining strategies.
- False-signal growth: Poorly tuned anomaly models generate alert volume that exceeds what signatures produce, defeating the purpose of the investment.
- Model bias: Training data that does not represent the production environment produces models that miss real attacks or flag legitimate behavior.
- Operational trust issues: Analysts who do not understand why an AI model scored an alert high will either over-trust it or ignore it. Both outcomes are dangerous.
The governance principle for AI in detection is the same as for any other production system: if you cannot explain why a model produced a specific output, you cannot defend the decision it informed. Log model inputs, outputs, and confidence scores. Treat AI-generated alerts as decision-support, not verdicts. Require human review before any AI-generated rule reaches production.
For organizations building AI governance alongside detection capabilities, the NIST AI RMF applicability guide from Heightscg provides a practical framework for deciding which AI RMF controls apply to your specific program. The AI governance playbook extends that into operational controls you can implement immediately. For broader context on how AI changes detection signal characteristics across sectors, the AI and financial crime analysis from ai-thea.com illustrates how AI-enabled attack vectors are reshaping detection requirements in regulated industries.
Pro Tip: Treat AI outputs as decision-support, require human-in-the-loop review for any production change an AI model recommends, and log model inputs and outputs with the same rigor you apply to detection rule changes. That log is your audit trail when a regulator asks how an alert was generated.
Common obstacles in detection engineering and how to address them
Most detection programs stall at the same predictable points. Recognizing the pattern early prevents months of wasted effort.
Problem-solution pairs:
- Missing telemetry: Rules written before telemetry is confirmed available produce silent failures. Fix: run a telemetry gap analysis before authoring any rule. Map required fields to current log sources and instrument gaps before the rule enters development.
- Alert overload: Deploying rules without backtesting produces false-positive floods that destroy analyst trust. Fix: require backtesting against 30 days of historical logs as a gate before canary deployment.
- Stale rules: Rules with no owner and no validation date accumulate silently. Fix: implement a quarterly rule review SLA and a retirement program with documented criteria.
- No traceability: Rules that cannot be tied to a business driver cannot be justified in an audit or a budget review. Fix: enforce metadata requirements (use-case ID, risk register reference) as a CI pipeline gate.
- Telemetry quality issues: Logs that arrive without timestamps, truncated command lines, or inconsistent field names produce unreliable detections. Fix: instrument log quality checks in the pipeline before rules consume the data.
Checklist for preventing common process failures:
- Every rule has a named owner before it enters development
- Every rule has positive and negative test fixtures before it enters canary
- Every rule maps to a confirmed telemetry source before design begins
- Every rule has a documented use case tied to a risk or compliance driver
- Every retired rule has a logged rationale and approver
Pro Tip: Resource-constrained teams should establish a "critical few" rule pipeline: maintain 10–20 high-confidence, high-coverage rules at production quality rather than 200 rules in various states of decay. A monthly purple-team cycle focused on those critical rules delivers more measurable coverage than a large backlog of untested detections.
A 30/90/180-day roadmap to build or mature your detection program
This roadmap reflects the engagement structure Heightscg uses with clients who are standing up or maturing a detection engineering capability. Each milestone has discrete deliverables that leadership can budget and staff against.
30-day: Discovery and foundation
- Conduct a telemetry gap analysis against the organization's top 10 ATT&CK techniques.
- Inventory existing detection rules: identify owners, test status, and ATT&CK coverage.
- Select 3–5 priority use cases based on business-impact threat model.
- Author 1–3 DaC rules with full metadata and test fixtures for the highest-priority use cases.
- Establish governance baseline: rule template, metadata schema, PR review policy, and decision log.
Deliverables: Telemetry gap report, priority use-case backlog, 1–3 validated rules in canary, governance documentation.
90-day: Pipeline and validated coverage
- Stand up a DaC repository with CI/CD pipeline (lint, test, compile, canary deploy).
- Build test harnesses for positive and negative fixture execution.
- Deploy 5–10 validated rules covering at least three ATT&CK tactics.
- Schedule monthly BAS runs using Atomic Red Team against covered techniques.
- Conduct first purple-team exercise with red team executing 2–3 scenarios.
Deliverables: Operational DaC repo, CI/CD pipeline documentation, 5–10 production rules, first purple-team report, BAS schedule.
180-day: Measurable program
- Publish an ATT&CK coverage dashboard visible to CISO and detection team.
- Set per-tactic coverage targets and track progress monthly.
- Automate validation replay on a weekly cadence.
- Implement retention and retirement policies with documented criteria.
- Complete knowledge transfer and handover documentation for ongoing operations.
Deliverables: Coverage dashboard, automated validation schedule, retirement policy, operations runbook, program maturity assessment.
Pro Tip: At the 30-day mark, resist the pressure to deploy more rules than you can validate. Three rules that fire reliably and generate trusted alerts do more for SOC confidence than 30 rules that analysts have learned to ignore.
For threat hunting workflows that complement this roadmap, and for incident response integration that ensures detections connect to response playbooks, Heightscg maintains dedicated practice areas for each discipline.
What actually matters when you implement detection engineering
The programs that succeed share one characteristic that has nothing to do with tooling: someone with authority owns the outcome. Not the SIEM vendor. Not the SOC manager who already has a full queue. A named detection engineering lead with a backlog, a pipeline, and a quarterly review with the CISO.
The second pattern worth naming is the gap between detection coverage and detection confidence. Organizations routinely report high ATT&CK coverage percentages while their SOC analysts quietly suppress alerts from half those rules because the false-positive rate makes them unreliable. Coverage without confidence is a compliance artifact, not a security control. The metric that matters is the true-positive rate per rule, tracked over time, with a clear owner responsible for improving it.
The LLM-noise problem makes this more urgent. As attackers use AI to generate higher volumes of plausible-looking activity, signature-based rules degrade faster. The programs that will hold up are the ones built on behavioral detection, entity baselining, and continuous validation — not the ones with the largest rule libraries.
How Heightscg supports detection engineering programs
Heightscg works with security leaders across regulated industries to design, build, and operate detection engineering programs that produce measurable coverage and defensible audit trails. The engagement model is structured around three scopes: a Detection Engineering Assessment that delivers a telemetry gap analysis, a priority use-case backlog, and a governance baseline in 30 days; a Pilot DaC Implementation that stands up a CI/CD pipeline and deploys 5–10 validated rules in 90 days; and a Managed Detection Program that operates the full lifecycle, including monthly BAS runs, quarterly purple-team exercises, and a CISO-facing coverage dashboard.
Every engagement produces discrete, client-owned deliverables: rule repositories, test harnesses, governance documentation, and coverage reports. The program is designed to transfer operational capability to your team, not create dependency on an external provider. For organizations in healthcare, defense, or financial services, the compliance traceability built into the DaC methodology directly supports HIPAA, CMMC, and PCI-DSS audit requirements.
To discuss an assessment or pilot engagement, contact Heightscg or review the technical consulting overview to understand how engagements are scoped and staffed.
Primary sources and further reading
- What Is Detection Engineering? A Complete Guide to Modern Threat Detection — Splunk: foundational definition, lifecycle overview, and DaC principles.
- NIST AI Risk Management Framework: governance structure for trustworthy AI adoption, including Generative AI profile and critical infrastructure guidance.
- Detection Engineering in 2026: The Complete Lifecycle — Kraven Security: six-phase lifecycle, Sigma and YARA patterns, CI/CD pipeline detail, and AI integration guidance.
- Detection Engineering and Cloud Logging — CSOH: cloud telemetry considerations, Sigma portability, and validation steps including BAS for cloud environments.
- Purple Teaming: Threat-Informed Detection Engineering — SANS: continuous validation practice, purple-team cadence, and detection fidelity improvement.
- Detection Engineering Lifecycle — CiscoCXSecurity on GitHub: structured 12-phase methodology with traceability and retirement discipline.
- Detection Engineer Salary — ZipRecruiter: US compensation data for detection engineering roles, with a reported median of $157,400 per year.
Sources
- What Is Detection Engineering? A Complete Guide to Modern Threat Detection | Splunk
- NIST AI Risk Management Framework
- Detection Engineering In 2026: The Complete Lifecycle (Sigma, YARA, DaC & AI) - Kraven Security
- Detection Engineering & Cloud Logging - CSOH
- Purple teaming: Threat-informed detection engineering | SANS